Data
Analytics
Dashboard in
Mumbai
In the dynamic world of business leadership, staying ahead requires a strategic edge. Your gateway to data-driven, agile decision making.
START YOUR ANALYSIS
Features of Analytical Dashboard in Mumbai
Sales Performance Metrics
Utilize key performance indicators such as sales growth rate, conversion rate, average deal size and sales velocity to evaluate your sales team's effectiveness.
Sales Pipeline Visualization
Get a visual overview of leads, opportunities and deals at every stage with conversion rates, expected revenue and pipeline movement.
Total Sales Revenue
View sales revenue by daily, weekly, monthly, quarterly and yearly periods, and compare performance with previous periods to identify trends.

Top Salespeople or Teams
Highlight the top performing salespeople, teams or regions based on revenue generated, deals closed and other relevant sales performance metrics.
Components of Sales Analytical Dashboard
Customer Acquisition and Retention
Analyze customer acquisition cost, customer lifetime value and churn rate to evaluate customer acquisition and retention strategies.
Sales Funnel Analysis
Examine sales funnel stages including leads, prospects and opportunities along with conversion rates and average time taken to close deals.
Sales by Geography
Visualize sales data on a geographical map to identify high-performing regions and potential expansion opportunities.
Forecast Accuracy
Assess the precision of sales forecasts by comparing predicted figures with actual results.
Sales Channel Analysis
Compare revenue and profitability from direct sales, online sales, resellers and other channels.
Product/Service Performance
Monitor product-wise and service-wise sales to identify best-sellers and slow-moving offerings.
Sales Team Performance
Track team productivity using meetings, call volume, closures, targets and quota attainment.
Customer Insights
Understand customer behaviour, segments and demographics to improve business decisions.
Sales Goals and Objectives
Track short-term and long-term sales goals, target progress and objective completion.

Customer Feedback and Sentiment Analysis
Incorporate customer feedback and sentiment analysis from surveys and social media to gauge customer satisfaction and market sentiment.
Historical Sales Trends
Analyze historical sales data to identify seasonality, cyclical patterns and long-term growth trends.
Sales by Product Category
Segment sales data by product categories or SKU numbers to identify high-performing product lines.
Mobile Access
Ensure that the dashboard is accessible on mobile devices so leaders can monitor business performance while on the go.
Alerts and Notifications
Set up alerts for significant sales milestones, deviations from targets and other critical business events.
Data Drill-Down
Allow users to drill down into specific sales data for more detailed analysis when required.

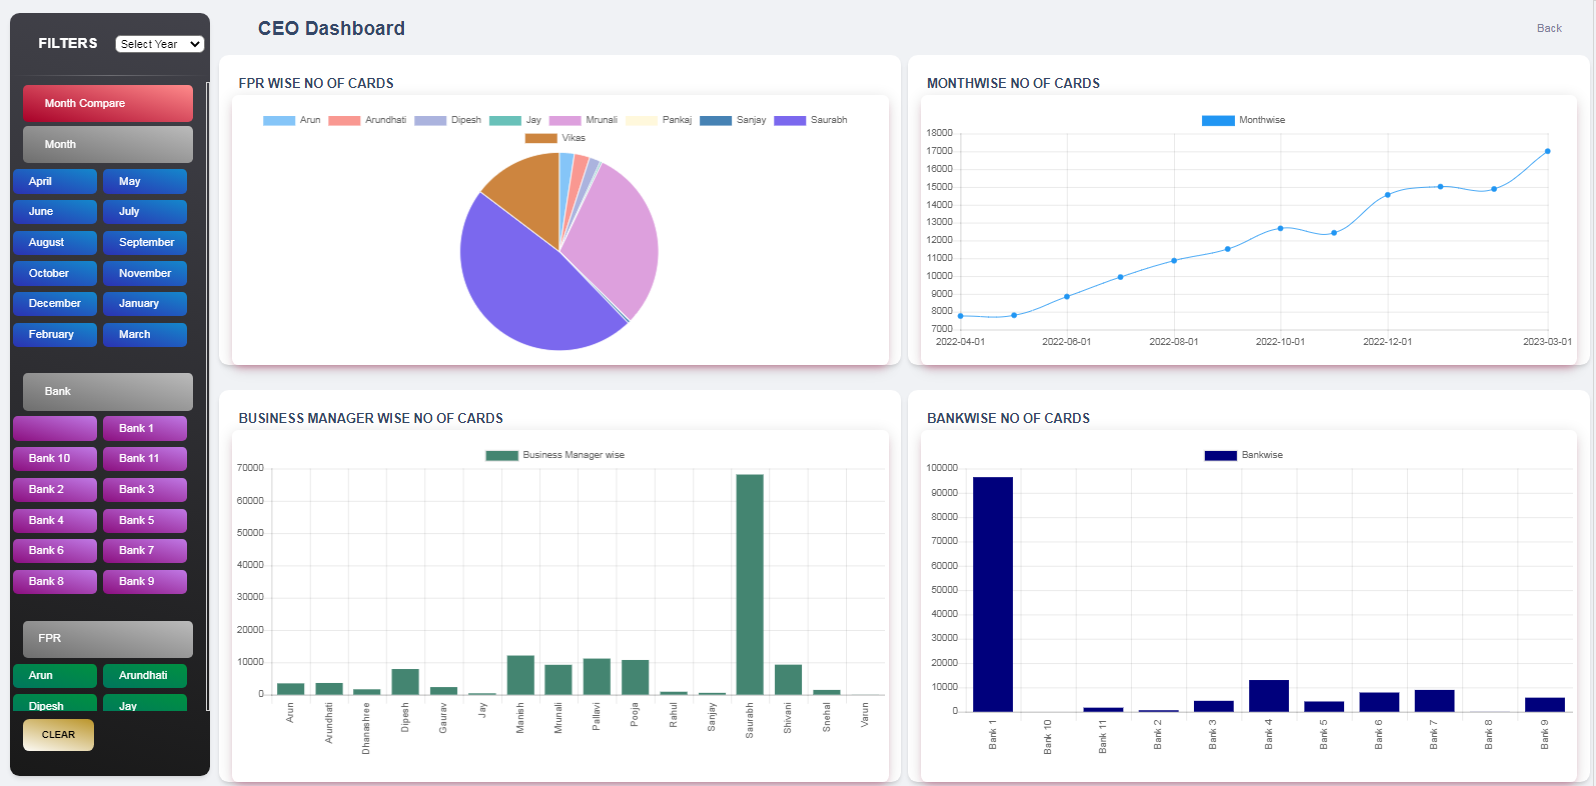
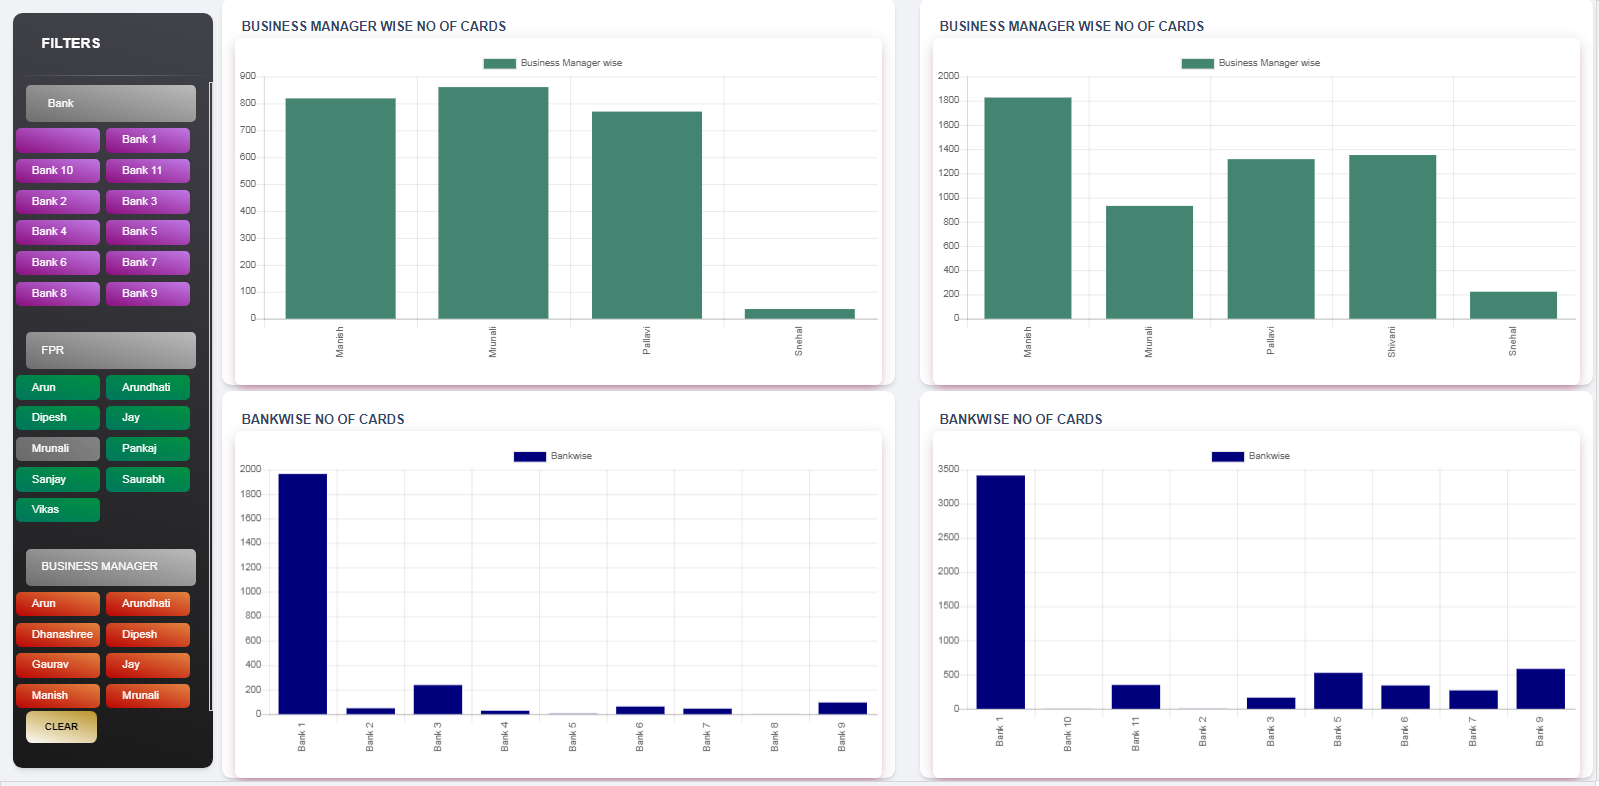
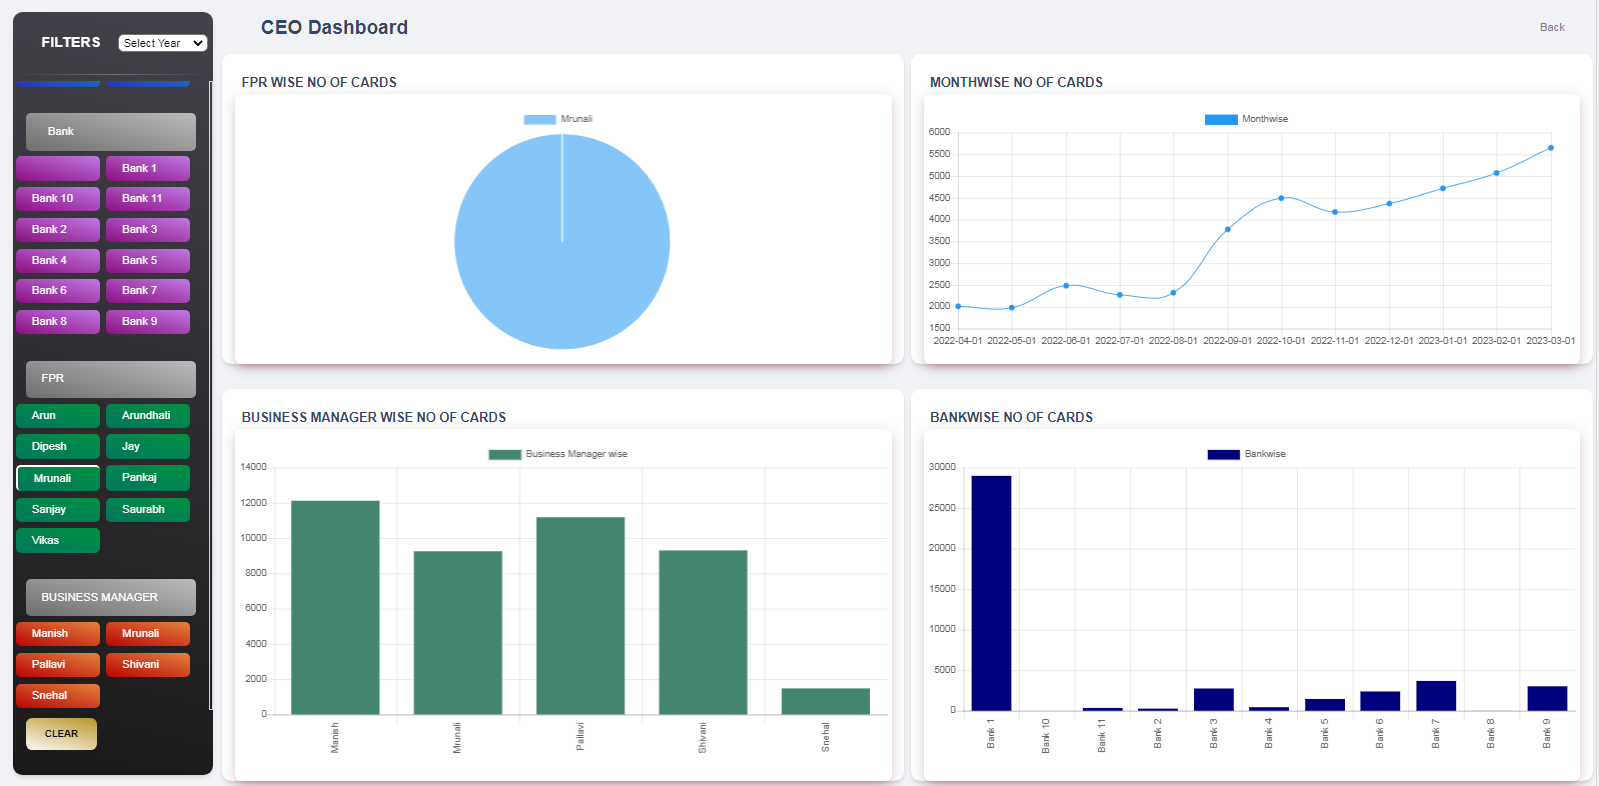
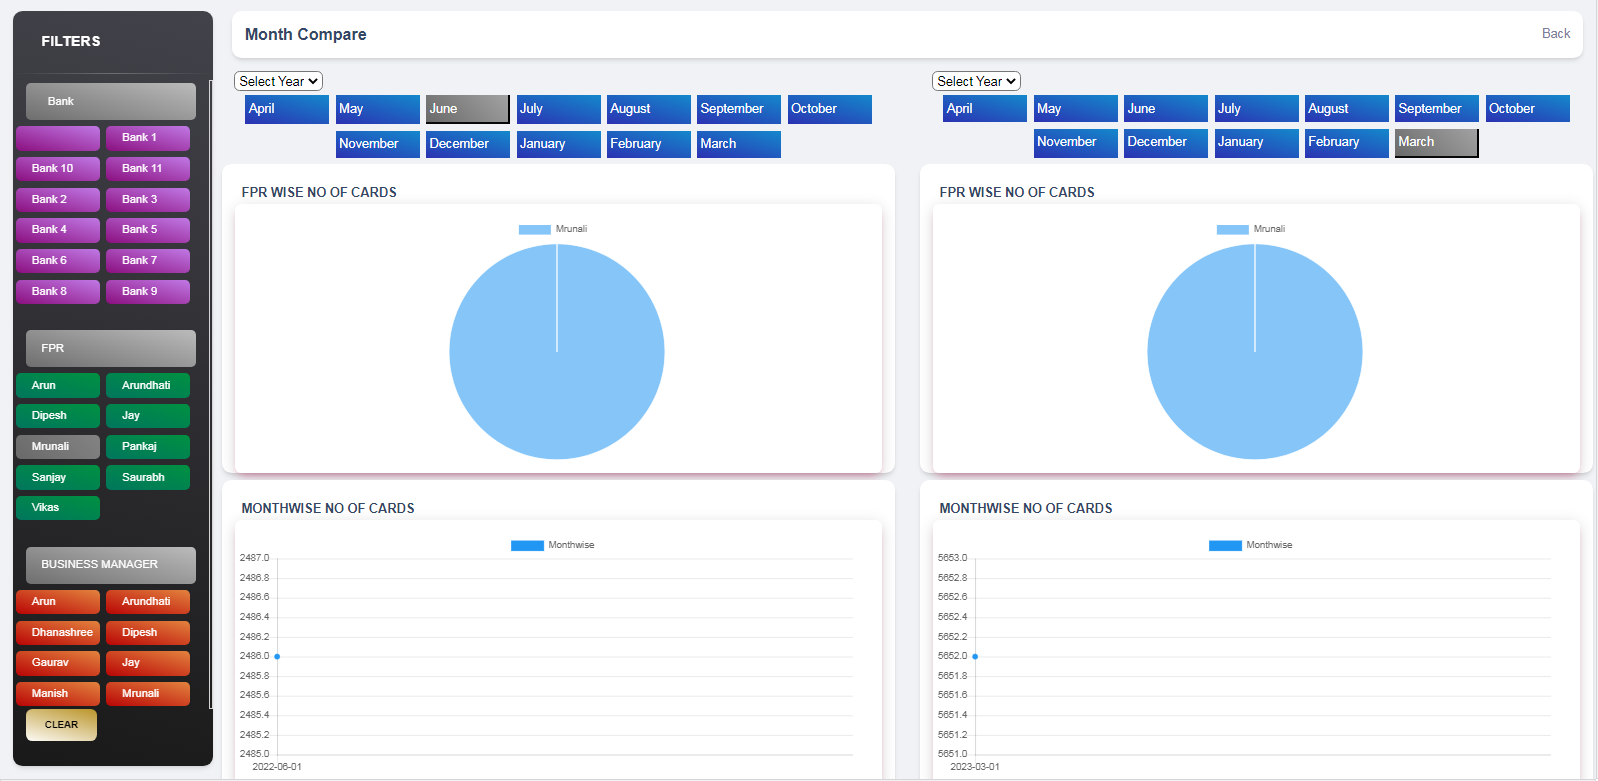
The T3 Analytical Dashboard is a vital component of CRM systems, delivering executives a holistic view of key metrics and insights. With functionalities ranging from CEO login to executive project dashboards and owner dashboards, it supports strategic oversight across departments.
Best practices in executive dashboard design are essential for clarity and usability. The T3 Analytical Dashboard works as a centralized hub for critical information, giving leadership a clear window into business performance, trends and opportunities.
Don't Miss Out On The
Transformative
Power Of T3 Analytical
Dashboard CRM.
Join Us To Know More About T3 CRM ERP
Schedule Personalized FREE Demo For You Today!
SCHEDULE DEMO NOW